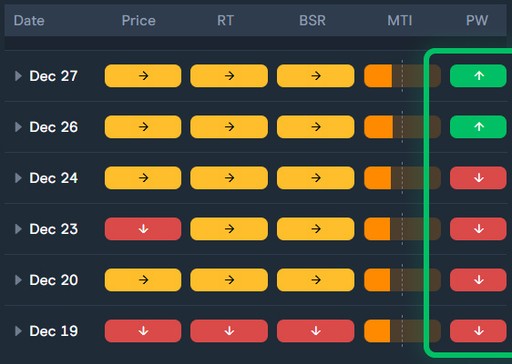
What do these indicators mean?
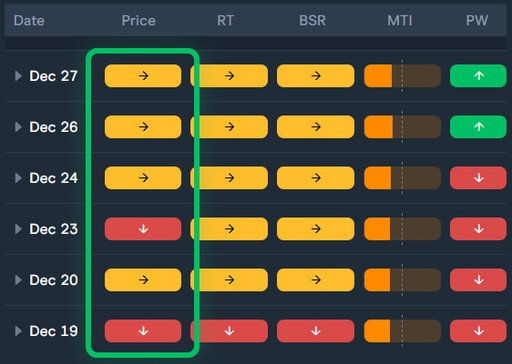
“Price” aka the VectorVest Composite (VVC)
One key factor that can influence your chances of success in the market is the overall market trend. As the saying goes, "a rising tide lifts all boats." Similarly, when the stock market is on an upward trajectory, more stocks tend to participate in the rally than those that decline. Investing during a rising market increases the likelihood of selecting stocks that rise in price, even those with weaker fundamentals. Conversely, when the market is declining, even top-performing stocks can suffer.
Price column in Advanced Market Timing
The VectorVest Composite (VVC) is our broad-market index and the foundation of our market analysis. It is an arithmetic indexed average of all the stocks in our database. The VVC provides a more accurate reflection of the overall market's movement. At times, you might notice major indexes showing mixed results—such as the Dow Jones declining while the S&P rises—leading to confusion about the market's true direction. By following the VVC, we gain a clearer understanding of broader market trend. VectorVest has developed market timing signals to identify the current trend of the VVC movements, thereby enhancing your chances of success. The core philosophy of VectorVest is to buy stocks that are rising in price, in a rising market. We do not advocate buying stocks when the market is in a downward trend.
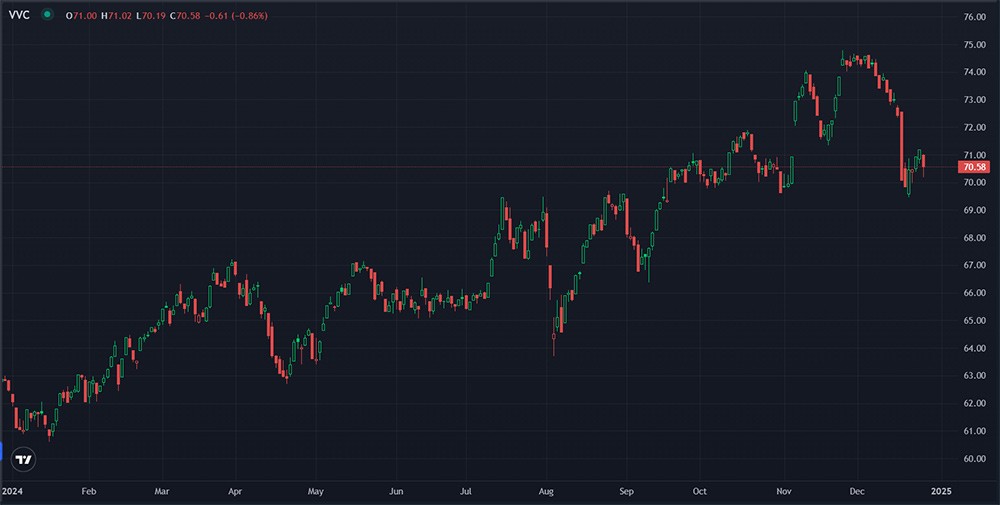
1 year graph of the VVC
RT (Relative Timing)
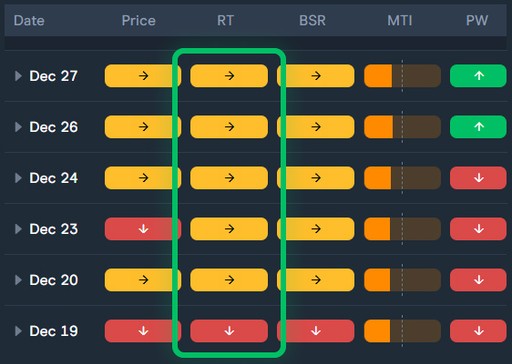
RT evaluates the direction, strength, and dynamics of a stock’s price movement on a scale from 0.00 to 2.00. An RT above 1.00 indicates the price is in an uptrend, while an RT below 1.00 signals a downtrend. It surges upward from market bottoms and plunges from peaks, capturing movements invisible to the naked eye. When a stock’s price levels off, it automatically resets to 1.00. Since RT monitors price movement, it can be applied to individual stocks, ETFs, and the overall market (VVC).
RT column in Advanced Market Timing
BSR (Buy to Sell Ratio)
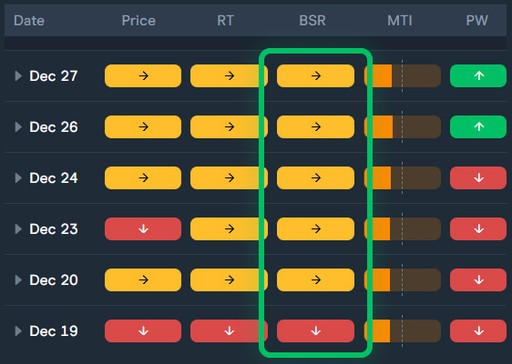
Each day, VectorVest assigns a Buy, Sell, or Hold rating to every stock in its database. Typically, Buy-rated stocks are in an uptrend, while Sell-rated stocks are trending down. The relationship between the number of Buys and Sells is tracked through a proprietary indicator known as the Buy to Sell Ratio (BSR), which compares these ratings. Often referred to as the "canary in the coal mine," the BSR measures market breadth, indicating the strength or weakness of market rallies or pullbacks. When the BSR is above 1, it shows more stocks are rated as Buys than Sells, reflecting a healthy market. In contrast, a BSR below 1 signals that Sell-rated stocks outnumber Buy-rated ones, suggesting market weakness.
BSR column in Advanced Market Timing
MTI (Market Timing Indicator)
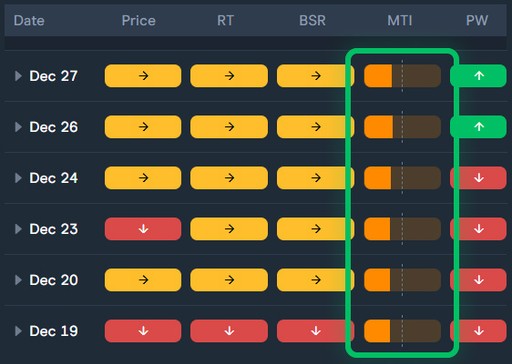
VectorVest uses a proprietary market trend indicator called the Market Timing Indicator (MTI) to gauge the market's underlying trend. The MTI combines the analysis of three key factors: the broad market movement measured by the VectorVest Composite (VVC), the trend direction and momentum indicated by Relative Timing (RT), and the breadth of these movements through the Buy to Sell Ratio (BSR). The MTI ranges from 0 to 2, where values above 1 indicate an "Up" trend, and values below 1 suggest a "Down" trend. The closer the MTI approaches the extremes of the scale, the stronger the trend signal becomes.
MTI column in Advanced Market Timing
Historically, when the MTI reaches 1.5 or higher, the market often begins to show signs of peaking, with the likelihood of a downside reversal starting to outweigh further upside potential. By the time the MTI reaches 1.5, portfolios should be largely invested, reducing the need to actively add new positions.
Historical examples of market downside reversals following the MTI reaching 1.50.
PW (Primary Wave)
The Primary Wave tracks the direction of the VVC on a weekly basis. If the VVC is higher than it was five trading days ago, the Primary Wave is considered Up. Conversely, if it’s lower than it was five days ago, the Primary Wave is Down(DN). It is regarded as a fast and more aggressive trend signal because it focuses solely on week-over-week changes.
PW column in Advanced Market Timing
