The Market is Searching for a Bottom
Market Timing: Hold
Continue to manage existing positions, plan your next moves, and learn more about the system.
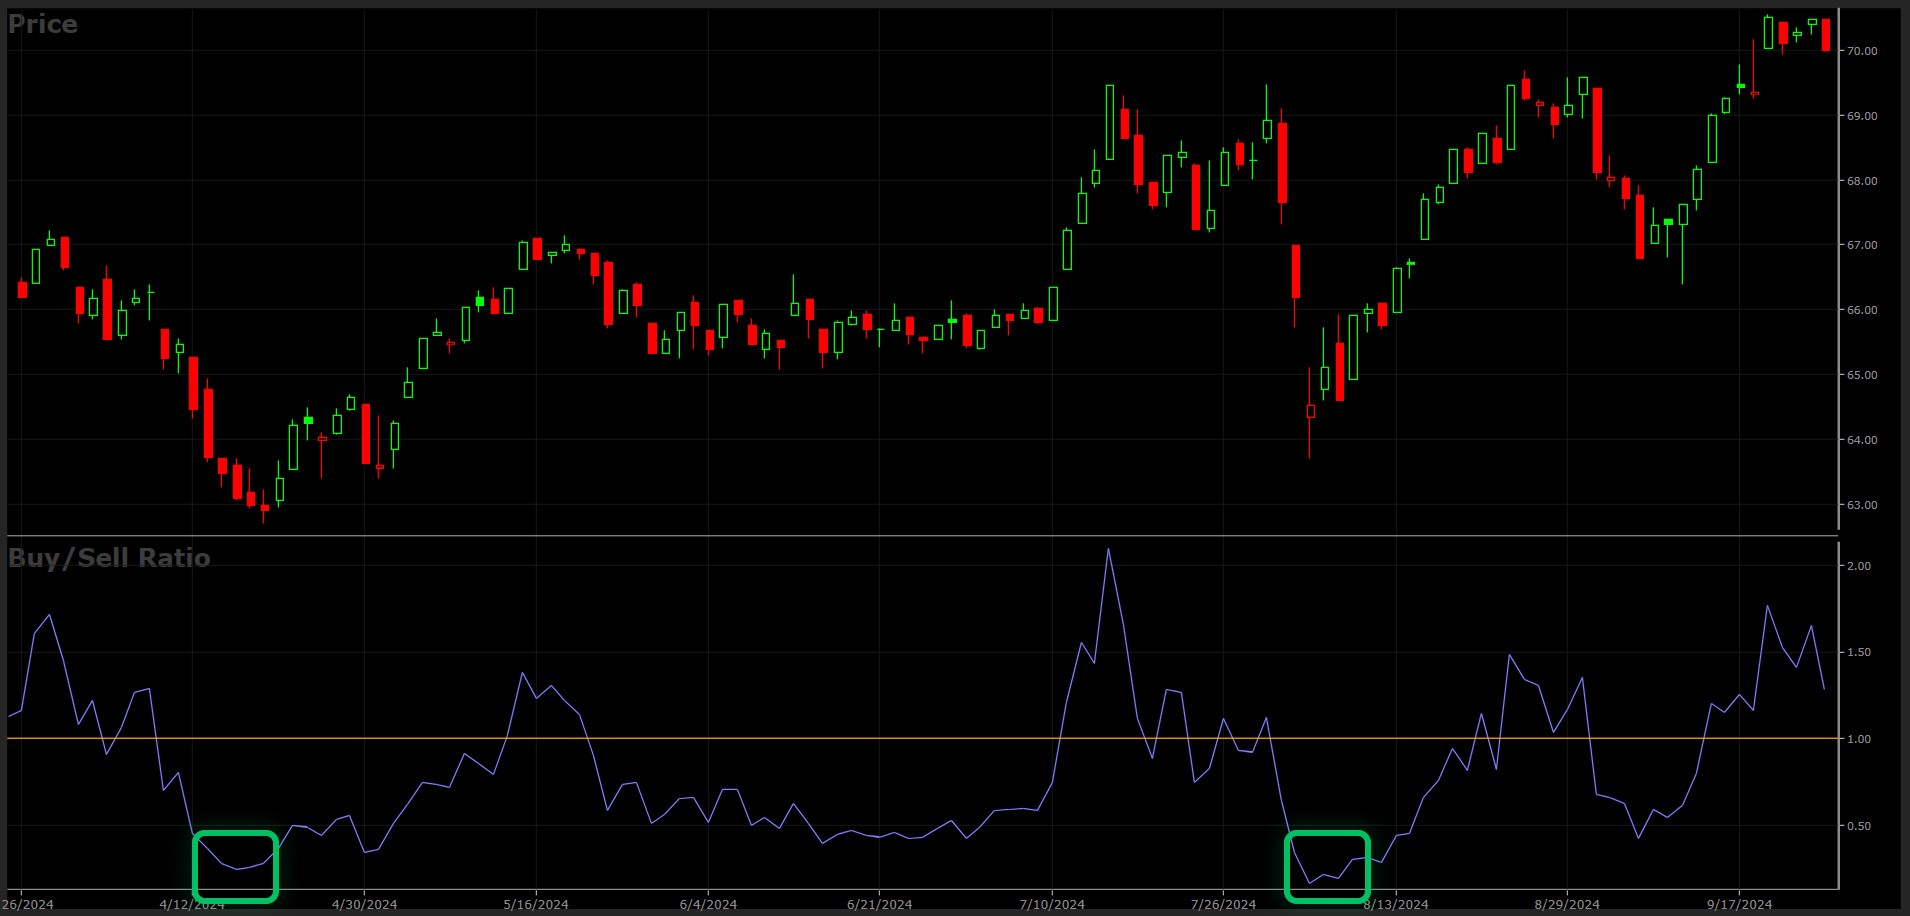
Each day, VectorVest assigns a Buy, Sell, or Hold rating to every stock in its database. Typically, Buy-rated stocks are in an uptrend, while Sell-rated stocks are trending down. The relationship between the number of Buys and Sells is tracked through a proprietary indicator known as the Buy to Sell Ratio (BSR), which compares these ratings. Often referred to as the "canary in the coal mine," the BSR measures market breadth, indicating the strength or weakness of market rallies or pullbacks. When the BSR is above 1.00, it shows more stocks are rated as Buys than Sells, reflecting a healthy market. In contrast, a BSR below 1.00 signals that Sell-rated stocks outnumber Buy-rated ones, suggesting market weakness. Currently, the BSR is below 0.20, indicating there are at least five Sell-rated stocks for every one Buy-rated stock.
Historical examples of market upside reversals following the BSR reaching 0.20.
As shown in the chart above, historically, when the BSR falls to 0.20 or lower, the market often starts to show signs of bottoming, with the likelihood of an upside reversal beginning to outweigh the potential for further decline. These reversals can be sharp and present excellent opportunities to reenter the market following a selloff. Be sure to have capital ready for when the signal turns to “Safe to Buy.”
