Canary Signal
Market Timing: Get Ready
Time to get your shopping list ready and be prepared to buy stocks when it’s safe to buy.
VectorVest tracks a proprietary market analysis indicator called the Buy to Sell Ratio (BSR), which divides the number of stocks rated as a Buy by those rated as a Sell. Each day, VectorVest assigns a Buy, Sell, or Hold rating to every stock, and we closely analyze the relationship between Buys and Sells. Often referred to as the "canary in the coal mine," this indicator gauges market breadth and assesses the strength or weakness of market rallies or pullbacks. When the ratio is above 1.00, it indicates that there are more stocks rated as Buys than Sells, reflecting a healthy market. Conversely, when it drops below 1.00, it signifies that there are more Sell-rated stocks than Buy-rated stocks, suggesting the market is exhibiting signs of weakness.
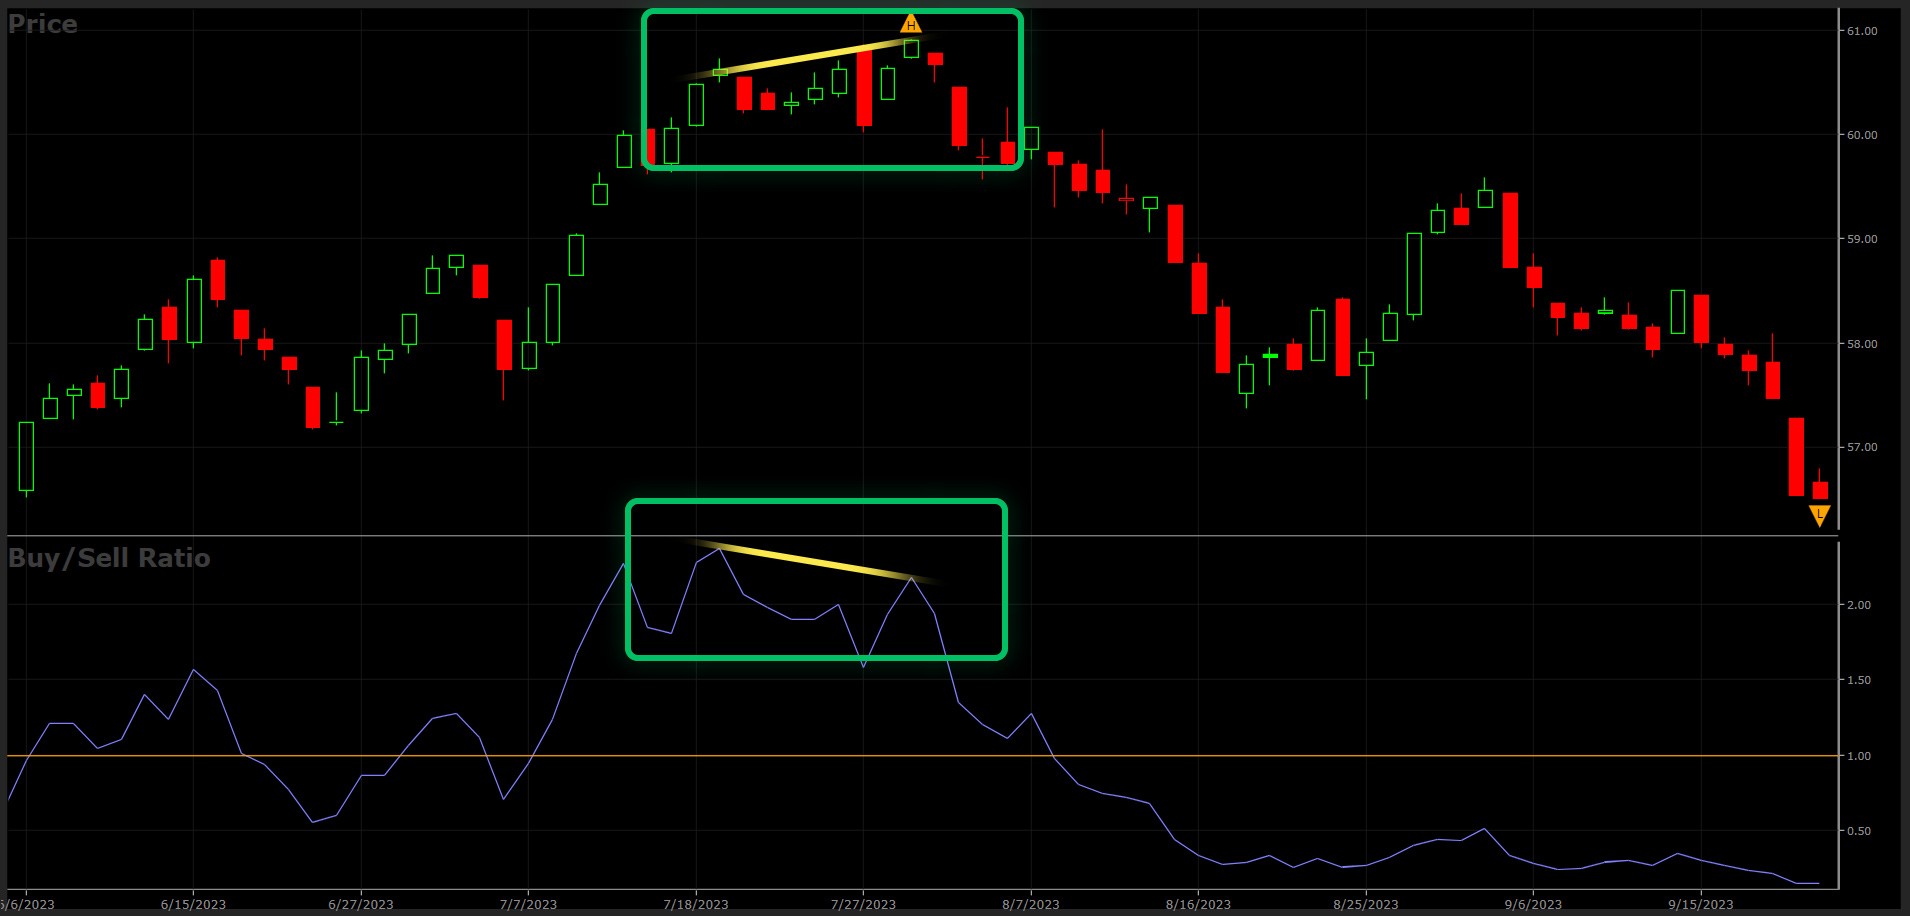
Example of this bearish divergence giving a warning of a coming pullback.
As illustrated in the chart above, a bearish divergence occurs when the price the VectorVest Composite (VVC) is hitting higher highs, but the Buy to Sell ratio (BSR) is hitting lower highs. This discrepancy can often signal a potential reversal in the market’s upward trend, suggesting that the momentum behind the price increase is weakening.
Investors often view bearish divergences as a warning sign that the market may be due for a pullback or a downward reversal. It suggests that buyers are losing strength, and the market may soon decline. A bearish divergence is an important concept that helps traders identify potential trend reversals and assess the strength of price movement.
